The core idea: the trigger is in the past
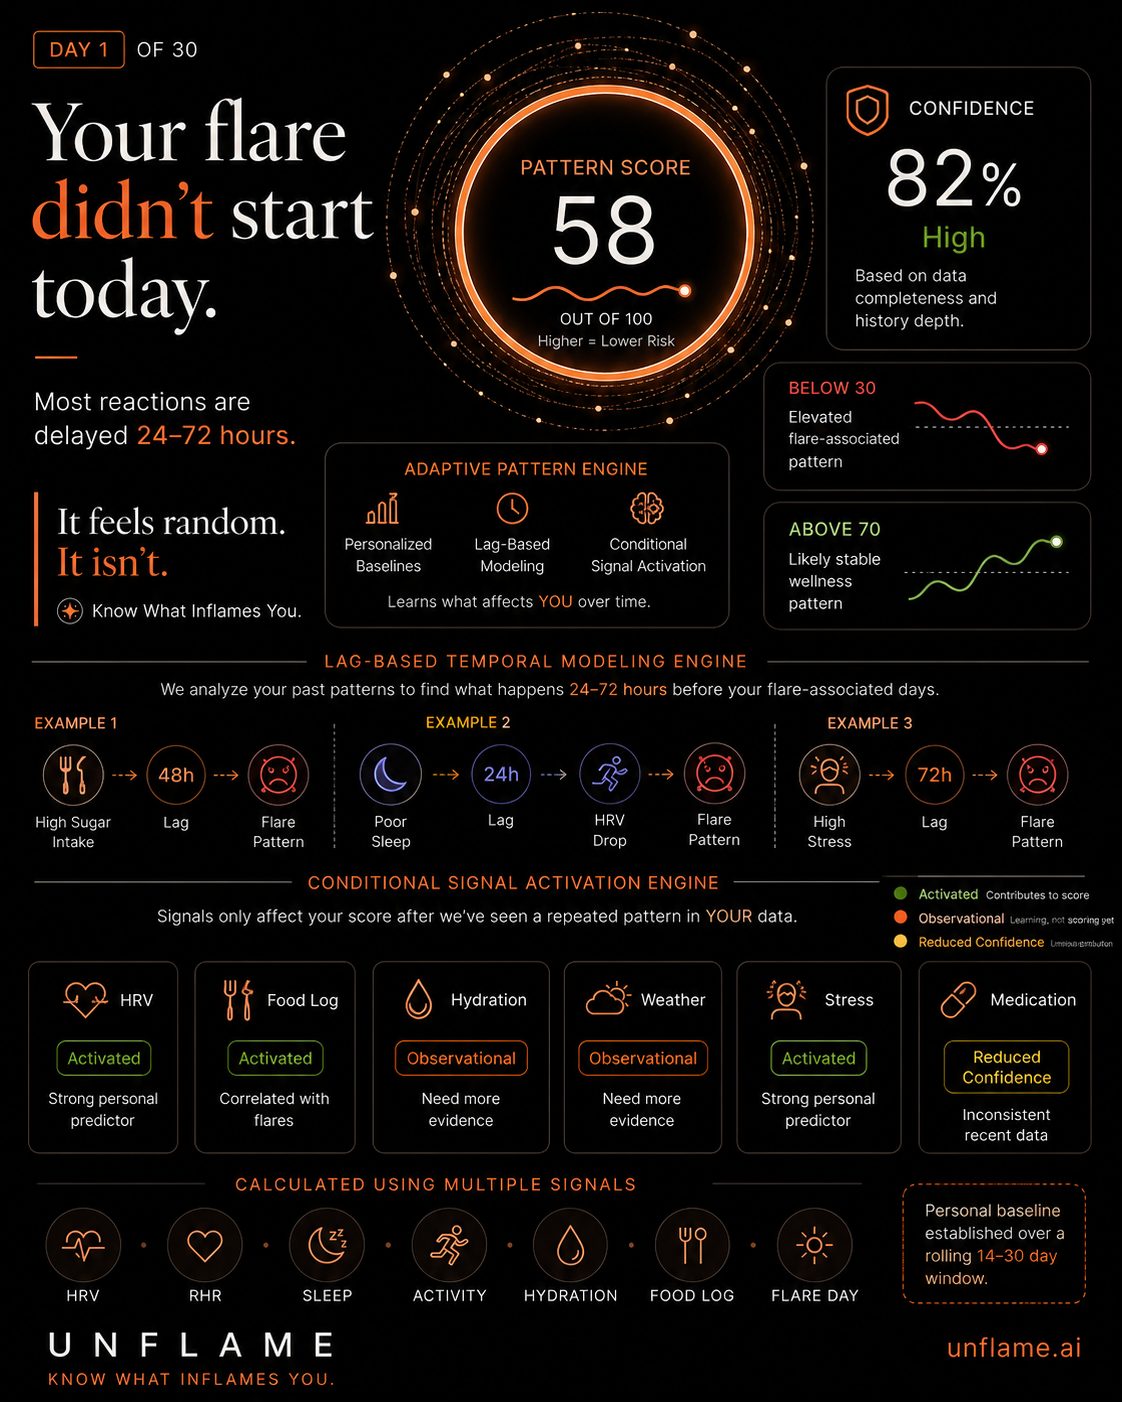
Most health apps score the same day: you slept badly today, your heart rate is up today, so today's score is low. That is fine for general fitness and wrong for chronic flares. In skin and gut conditions the reaction often lands a day or two or three after the exposure, and by the time the symptom shows up the trail is cold. Some reactions are faster and some are slower; the engine is built for the 24- to 72-hour band where day-to-day lifestyle exposures mostly fall, and the explainers cover the rest.
Two kinds of data
- Passive: what your Apple Watch or iPhone measures without you doing anything. Heart rate, heart rate variability (HRV), resting heart rate, sleep duration and quality, wrist temperature, breathing rate, steps and activity.
- Active: what you tell the app. Meals, water, alcohol, medication, stress rating, hours slept, and whether today was a flare day.
Passive data is reliable but cannot know what you ate. Active data is rich only if you log it. The engine is built to keep working when either has gaps: a signal missing on a given day is left out and the remaining weights are renormalised, rather than filled in with a guess.
Layer 1: your baseline, not the textbook's
A resting heart rate of 75 is normal for one person and a warning for another. So before anything is judged unusual the app learns what is normal for you, using an exponentially weighted moving average: each day's baseline is about 95% yesterday's baseline and 5% today's value. One odd day barely moves it; a few weeks of change does. The same rolling estimate is kept for how much each signal normally bounces around.
Layer 2: how unusual is today?
Each day's value is expressed as a z-score, its distance from your baseline in units of your own usual variability. Zero is an ordinary day; +2 is unusual; +3 happens a few times a year. Z-scores put every signal on one scale, so an unusual night of sleep and an unusual HRV reading can be compared.
Layer 3: lag analysis
With z-scores for every signal and every day, and the flare days you logged, the engine asks: which signals tend to be unusual 24, 48 or 72 hours before a flare? For each signal and each lag it counts the exposed days that were followed by a flare and the exposed days that were not. If sugar intake was high on eight days and six were followed by a flare two days later, that is a pattern; if two were, scattered across different lags, that is noise. The strength of each signal-and-lag pair is estimated with logistic regression.
Correlation, in one person. This is the step the rest of the site keeps warning about. Exposures travel together (the late dinner, the wine, the short night), flares change sleep and stress rather than only the reverse, and expecting a reaction produces part of one. Lag analysis in one person cannot untangle all of that. What it can do is show you, with dates and counts, which hypothesis deserves a planned test with a clinician.
Layer 4: the Pattern Confidence Metric
Counting is not enough; a careful detective also asks how many cases, how consistent, how strong, how widespread, how stable. For each signal the engine combines five pieces of evidence into one number between 0 and 1:
- Frequency: how many times the signal was followed by a flare.
- Consistency: whether the flares arrive at the same lag each time or are scattered.
- Magnitude: how strong the effect is when it appears.
- Recurrence: whether the signal shows up across many of your flare episodes or just one or two.
- Volatility: whether the pattern's strength has been steady or jumping around. Volatility counts against confidence; the other four count for it.
Layer 5: signals have to earn their place
A confidence number alone would let every weak hunch nudge the score. So each signal lives in one of three states and moves between them by rules:
| State | What it means | Effect on the score |
|---|---|---|
| Observational | Watched, evidence still accumulating. | None. |
| Activated | Confidence above about 0.70 and a minimum number of repeated exposure-flare instances. | Full, weighted by confidence and data quality. |
| Reduced confidence | Previously activated; recent data mixed. Confidence has stayed below the demotion threshold for seven consecutive days. | Reduced weight. Falls back to Observational after a further fortnight below the floor, or when recent instances are absent. |
The persistence rules exist to stop flapping. A signal cannot bounce between states on alternate days; it has to earn a promotion and earn a demotion.
Layer 6: the Pattern Score
Each day the Activated and Reduced-confidence signals vote, each weighted by its confidence and a reliability factor from data quality, and the weighted average is scaled to 0 to 100. Higher means today's multi-signal pattern looks less like your own past pre-flare days; below about 30 means it looks a lot like them. Observational signals contribute nothing. The score is a similarity measure against your own history, not a probability that you will flare tomorrow.
Two optional modifiers are part of the design: a lag-pattern similarity check that compares today's whole pattern with your historical pre-flare patterns, and an acute-infection check that uses baseline-normalised temperature and breathing rate to flag or attenuate the score when a cold rather than a flare is the likelier explanation.
Layer 7: the Confidence Score
A Pattern Score from 60 days of data and a watch worn every night deserves more trust than one from 12 days and a half-charged watch. So a separate Confidence Score (0 to 100, labelled low below 50, moderate to 74, high at 75 and above) is built from four things: how complete today's data is, how many days of history exist, how consistently the watch has been worn over the past fortnight, and how many flare days have been logged for the engine to learn from. You always see both numbers. A new user is told "low confidence" rather than shown a confident-looking score built on nothing.
What is different about this
- It learns you, not the population. Static rules (sleep under seven hours, lose five points) treat an athlete and a seventy-year-old the same. Here the same HRV drop can be a strong signal for one person and meaningless for another.
- It looks backward. Same-day scoring cannot see a 48-hour lag at all.
- It errs toward "I don't know yet." The state machine is designed against the two failure modes of wellness apps: false alarms (telling you something matters when it does not) and false reassurance (the reverse).
What it is not. Unflame is a wellness and lifestyle awareness tool. It is not a medical device, is not intended to diagnose, treat, cure or prevent any disease, and does not replace a clinician who has examined you. An Activated signal is a repeated correlation in your own data, presented as something to test, never as a confirmed trigger. If you have warning signs listed in the explainers, see a clinician regardless of any score.
Patent and provenance
The engine (personal baselines, lag-based temporal modelling, conditional signal activation through a three-state machine, and a Pattern Score paired with a Confidence Score) is the subject of a United States provisional patent application by REDPIERROT: "System and Method for Generating Personalized Adaptive Wellness Pattern Scores Using Lag-Based Temporal Modeling and Conditional Signal Activation". Patent pending. The method uses ordinary, inspectable arithmetic throughout: rolling averages, z-scores, lag-windowed counts, weighted sums and threshold rules. There is no opaque model between your data and your score.
Your data
The app is being designed around on-device, local-first storage with export in open formats; the website's own data handling is described in the disclaimer and privacy note.